
BlueOS and Node-RED: Steering Toward Continuous Discovery
By Tony White
Introduction
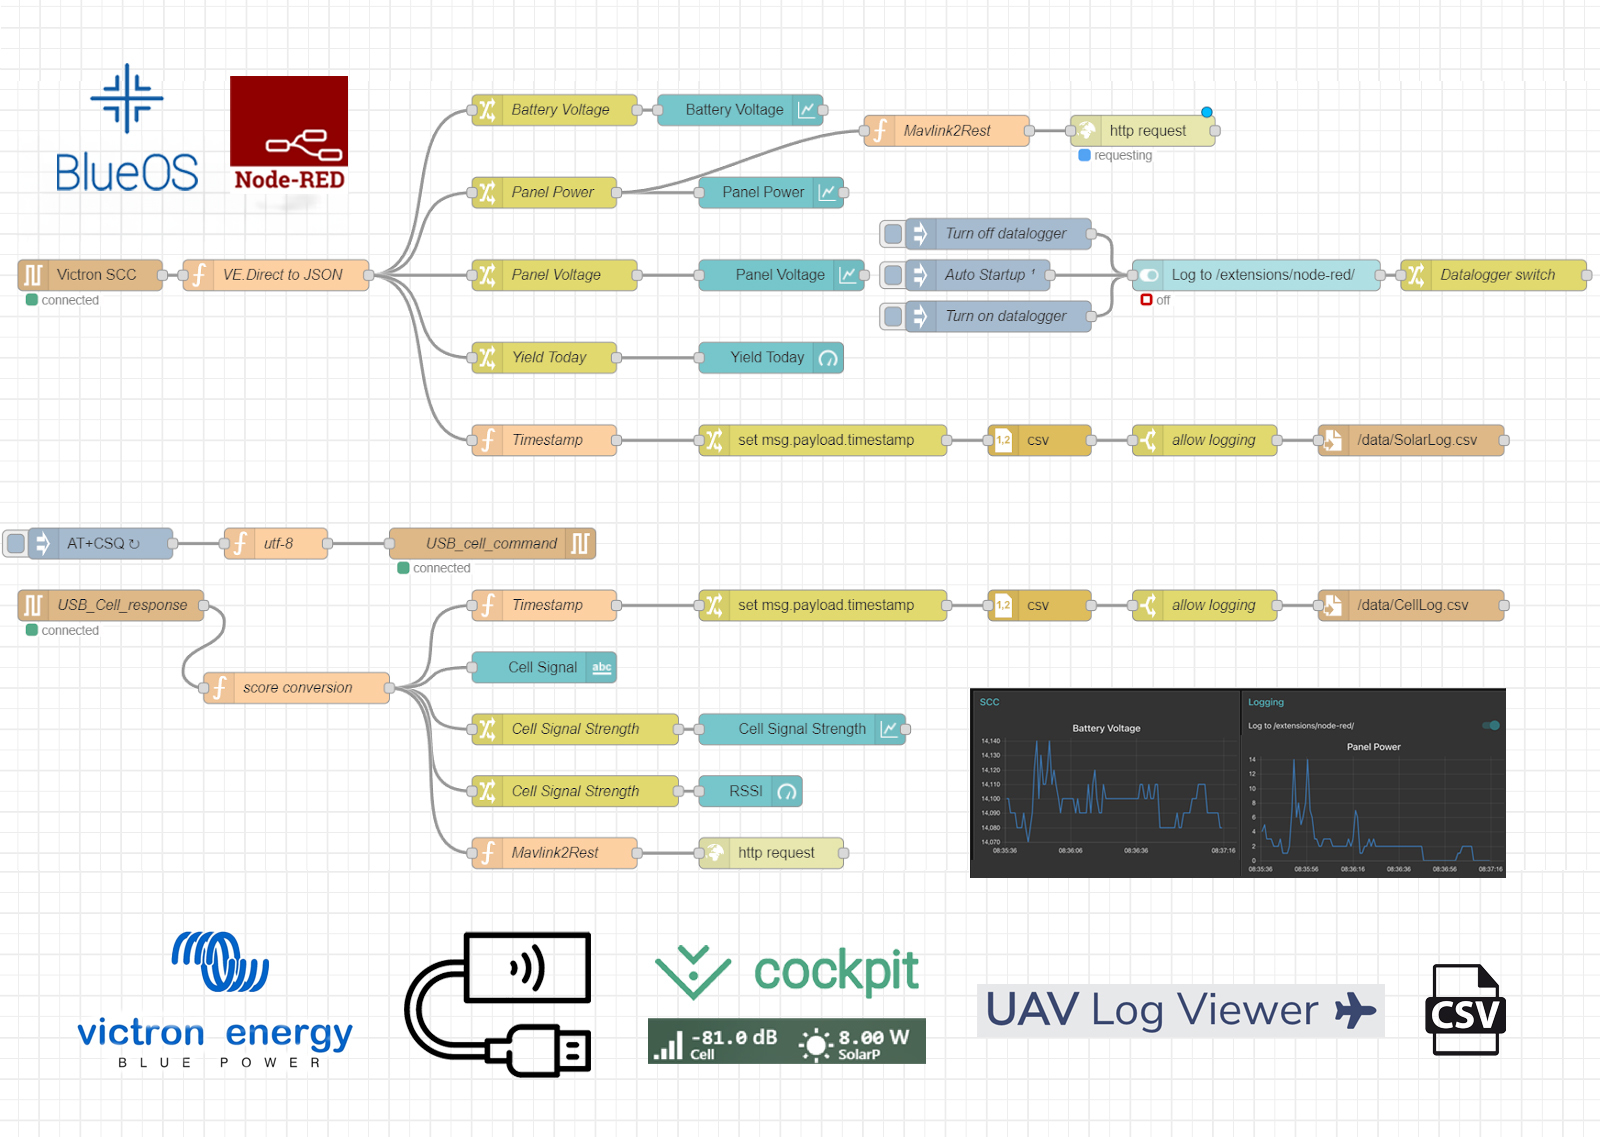
Node-RED is a powerful software tool that allows users to visually create simple software projects with a user-friendly interface and minimal JavaScript code. The examples illustrated here were accomplished during ongoing testing and development of the BlueBoat with solar power and cellular communications, to evaluate performance of panels, dowmodems and antennas. Node-RED makes collecting and comparing this performance data a cinch, and we wanted to share how easy it can be to interface with payloads in BlueOS with this approach. This guide will expand over time as we integrate and test more devices and Node-RED methods!
We’ll get started by reviewing how to connect multiple serial devices so they always connect, regardless of the /dev/ttyUSB# comm port name assigned by BlueOS. This is a common stumbling point! Next, various methods for processing incoming serial data will be illustrated, including data from a solar charge controller sent at 1Hz and responses from a USB cellular modem prompted for signal strength information.
After that, we provide examples of how to display this data on a Node-RED web dashboard while logging it to two different .csv files with timestamps. The data can also be routed to Mavlink2Rest, which will automatically include it in the .BIN log file created by the autopilot process. This ensures you have one log file from a mission that includes all possible autopilot and payload telemetry data, synchronized.
In the future, updates to Mavlink2Rest will support relaying data to other web socket connections, such as the one Cockpit uses. This will make adding data readouts from payloads to Cockpit via the generic mini-widget super easy! For now, we’ll close by presenting a workaround using a Lua script that enables the same functionality, allowing values to be displayed on the interface with the mini generic-indicator widget.
This guide is comprehensive, but for those who want to get started quickly, the completed flow is available for download.
We will keep this flow download link updated to include nodes for all provided examples, and the setup section will reflect the necessary palette dependencies. Hopefully this tutorial makes it easy to adapt the methods used here to your own applications and payload devices, even if you’re new to Node-RED. The Node-RED community is also a valuable resource if you need help using the imported data from your chosen source.
Node-RED Setup
First, make sure you’ve installed the Node-RED extension by clicking the Extensions menu item in the left side bar. Simply click the blue GET button and allow the installation to finish, and the docker container to start. After 2—3 minutes, the Node-RED menu option will appear in the BlueOS menu on the left!
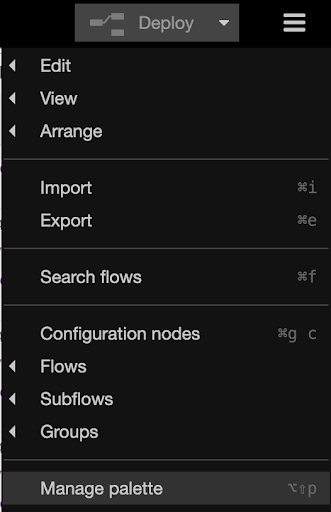
Next, we need to add the “palettes” that we will be using in these examples – palettes can be thought of as libraries that provide support for additional features. We will install palettes for the dashboards package that makes creating beautiful interfaces with graphs a cinch, as well as the nodes necessary for communication with a serial port from within the Node-RED extension docker container environment. Click the menu in the upper right and select Manage palette.
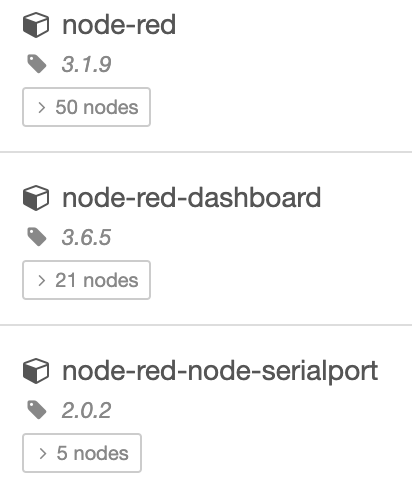
In the window that opens, select the install tab and add each of these palette modules:
Serial Device Setup: Victron Solar Charge Controller
Hardware Setup
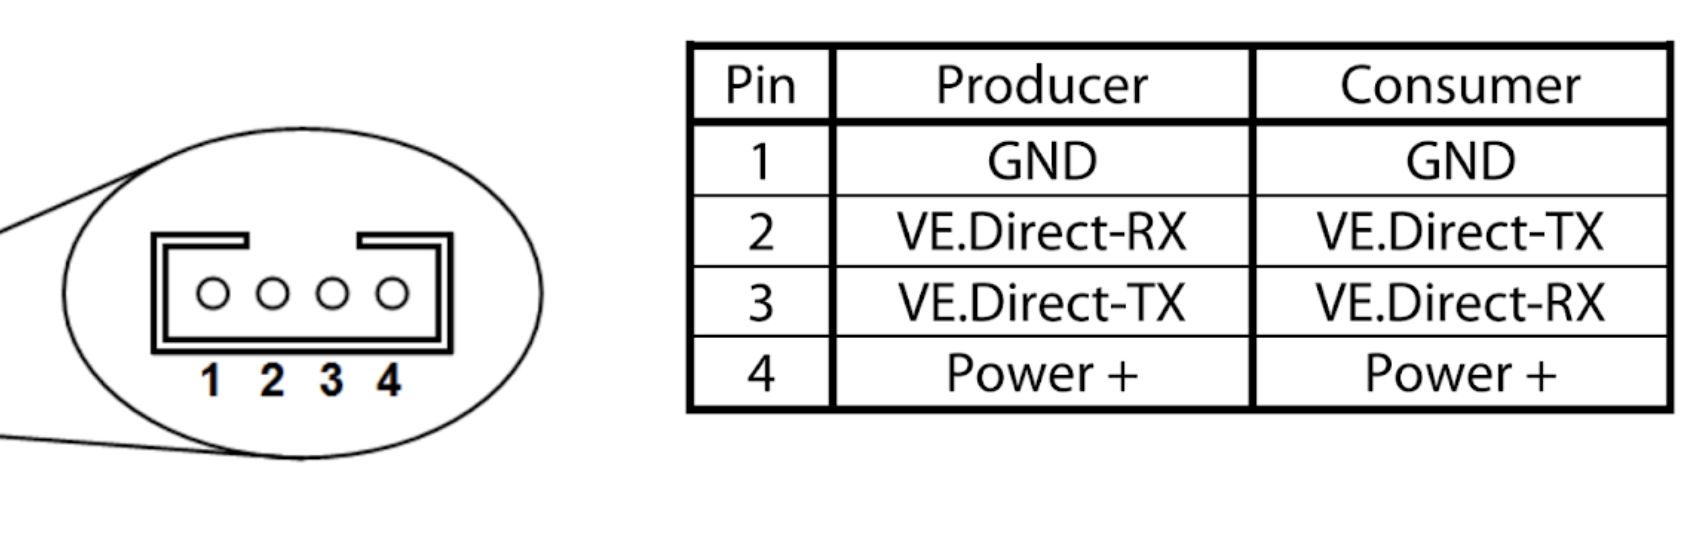
This BlueSolar 75/15 MPTT charge controller can be configured to charge a variety of batteries, including the BlueRobotics 4S lithium battery. You can read more about its communication protocol here. The charge controller can be connected to a Raspberry Pi 4 running BlueOS with a Victron USB cable, or any serial 5V TTL to USB converter. The pinout below shows how to connect to the device if using an adapter, you’ll need a JST-PH 4 connector.
Before diving into Node-RED, it’s important to determine the device is being detected appropriately. Connect the solar charge controller via USB to your BlueOS device, and supply it power on the battery terminals. Navigate to the BlueOS terminal, and type “red-pill” and push enter, which will give you access to the real world (outside of Docker.) Next, run:
ls /dev/serial/by-id
You should see an entry that looks something like:
usb-VictronEnergy_BV_VE_Direct_cable_VE3HBRXG-if00-port0
This is the device ID of the Victron USB cable – you may have a different entry depending on what serial to USB adapter you’re using.
Using a Serial Data Stream
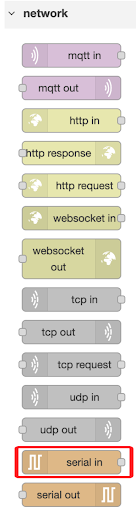
Once you’ve determined the device ID, add the serial in node to your flow by dragging and dropping it onto the page.
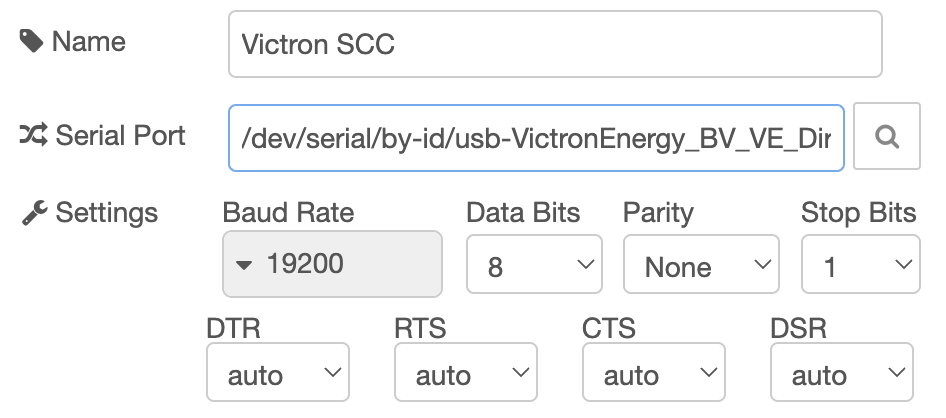
Double click the node, and click the edit pencil icon next to the Serial Port field. Give the Serial Port a logical name, and then paste the serial/by-id value from earlier into the Serial Port field that has the magnifying glass next to it. Set the Baud Rate to 19200, everything else can be left alone.
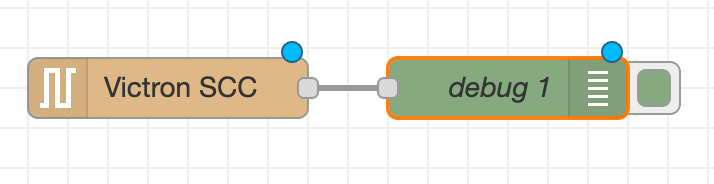
With that done, we can check out the output before moving on. Drag a debug node onto your flow and connect it as shown:
You can turn on and off the output of the debug node by clicking the green square on the right side of it. When colored in, the output appears in the debug menu on the right side, after selecting the bug icon.
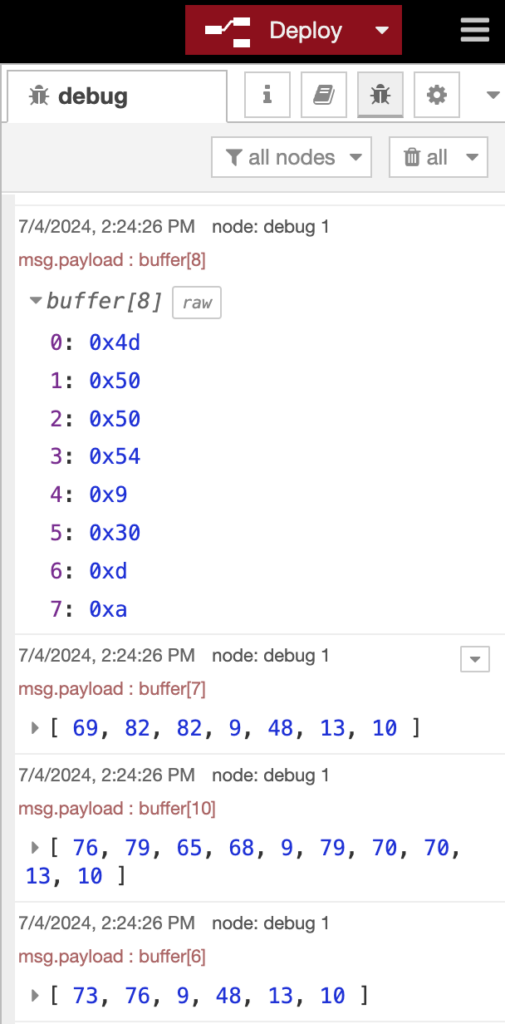
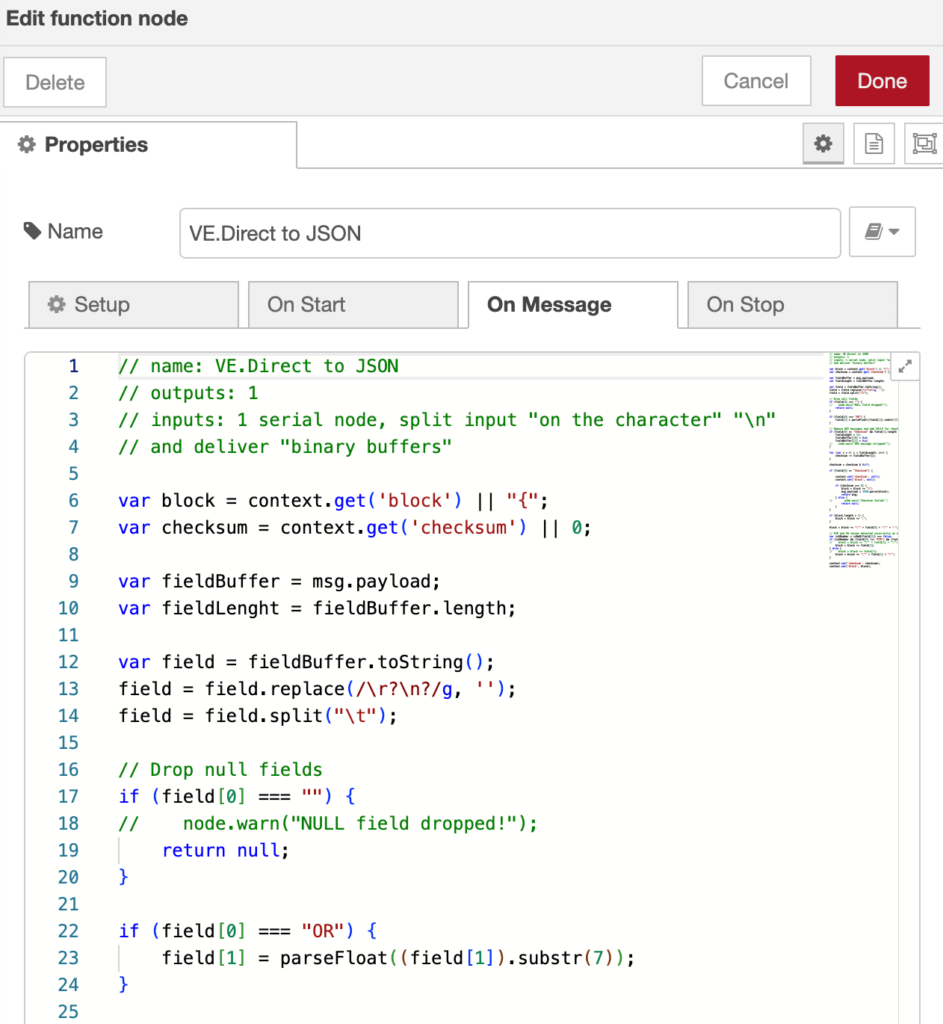
This shows we’re getting valid data, but now we need to convert it to human readable form! One of the great aspects of Node-RED is the very large, existing community. An existing function node to parse VE.Direct protocol data was found, and copied into the On Message portion of a function node.
// name: VE.Direct to JSON
// outputs: 1
// inputs: 1 serial node, split input "on the character" "\n"
// and deliver "binary buffers"
var block = context.get('block') || "{";
var checksum = context.get('checksum') || 0;
var fieldBuffer = msg.payload;
var fieldLength = fieldBuffer.length;
var field = fieldBuffer.toString();
field = field.replace(/\r?\n?/g, ");
field = field.split("\t");
// Drop null fields
if (field[0] === "") {
// node.warn("NULL field dropped!");
return null;
}
if (field[0] === "OR") {
field[1] = parseFloat((field[1]).substr(7));
}
// Remove HEX messages and add CR+LF for checksum
if (field[0] == "Checksum" && field[1].length > 1) {
fieldLength = 12;
fieldBuffer[10] = 0xd;
fieldBuffer[11] = 0xa;
// node.warn("HEX message stripped!");
}
for (var i = 0; i < fieldLength; i++) {
checksum -= fieldBuffer[i];
}
checksum = checksum & 0xff;
if (field[0] == "Checksum") {
context.set('checksum', null);
context.set('block', null);
if (checksum === 0) {
block = block += "}";
msg.payload = JSON.parse(block);
return msg;
} else {
// node.warn('Checksum failed!')
return null;
}
}
if (block.length > 1) {
block = block += ",";
}
block = block += "\"" + field[0] + "\"" + ":";
// PID and FW values detected incorrectly as number
var isANumber = isNaN(field[1]) === false;
if (isANumber && (field[0] !== "PID") && (field[0] !== "FW")) {
// block = block += "\"" + field[1] + "\"";
block = block += field[1];
} else {
// block = block += field[1];
block = block += "\"" + field[1] + "\"";
}
context.set('checksum', checksum);
context.set('block', block);
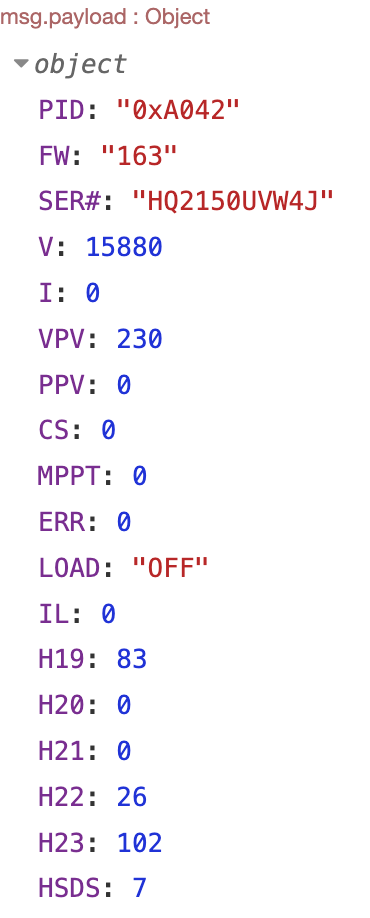
Function nodes let you do anything to message payloads that you may want, via javascript. This code converts the serial input into the following payload, which was checked with another debug node. The output shows the expected serial data described by the VE.Direct protocol, which is sent once per second by the device.
This is great! But the message from the solar charge controller doesn’t contain a timestamp, as the device has no clock. We can route the output of our function node that is translating the serial data through another function node to add a timestamp. This node will have the following code inside of it:
// Get the current timestamp
let timestamp = new Date().toISOString();
// Create a new payload object with the existing payload data and the timestamp
let newPayload = {
   …msg.payload,
   timestamp: timestamp
};
// Set the new payload to the message
msg.payload = newPayload;
return msg;
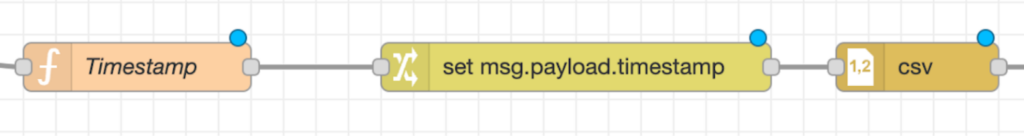
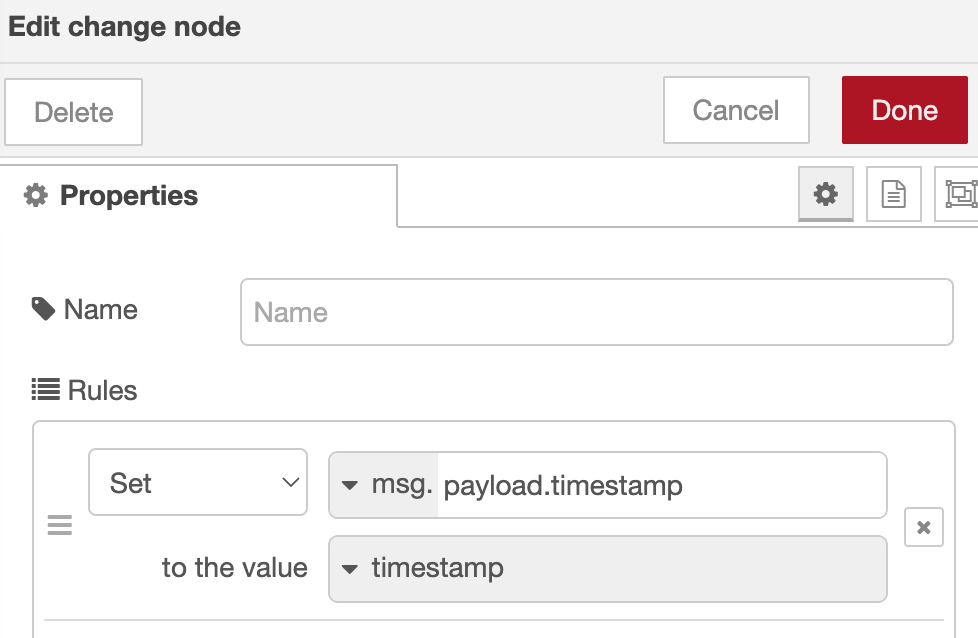
This will add a Unix-timestamp to the msg object, but not in the correct location. The output is routed through another node, this time called a “change” node. To get the time in the correct portion of the msg object, setup the node as seen below:
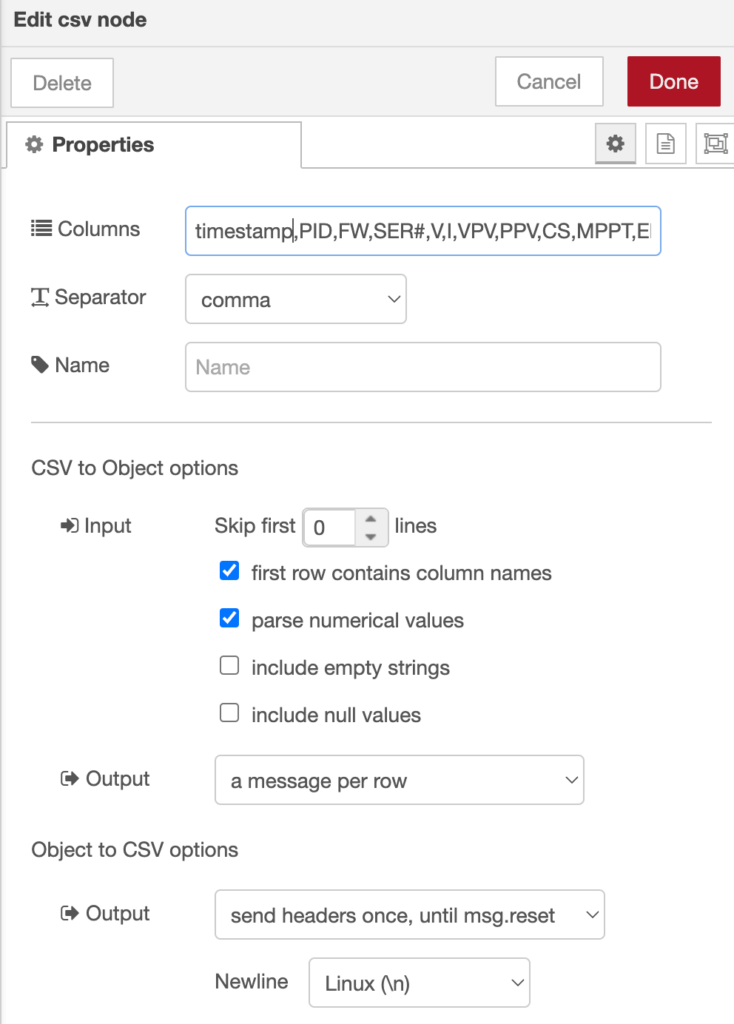
Next, we use the CSV node to specify the values in the object that we’d like to log, in the order that we’d like to log them. This is configured in the column’s field as shown below. Also note that under CSV to Object options, the setting is configured to send the column headers once per session. This gives you row in your log files every time you update the flow, or restart the entire system.
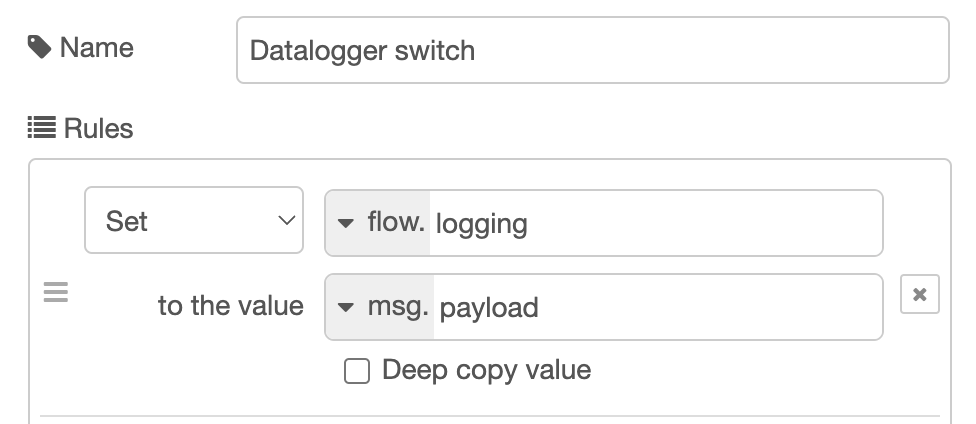
If you’d like to have the log file recording anytime the flow is active, then you can skip the next step. To control when logging occurs, a switch node can be used in conjunction with some independent nodes (inject, switch, and change). An additional node, the first GUI element thus far, is also used to create a switch on our dashboard to enable/disable logging.
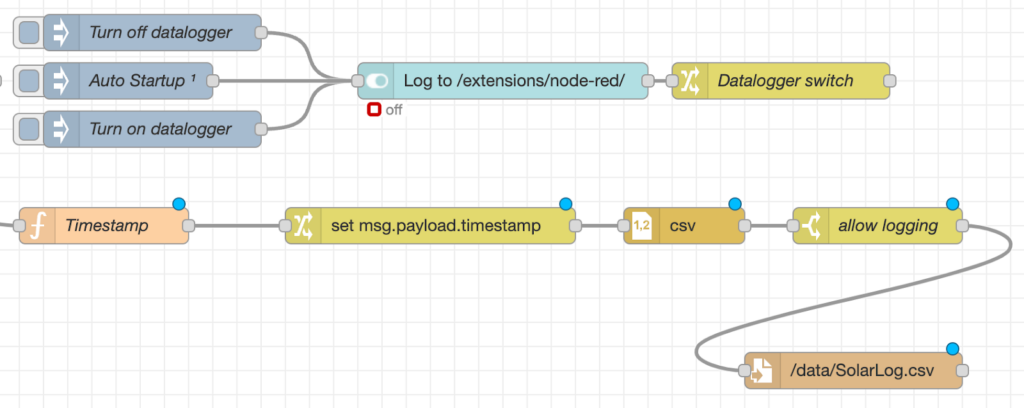
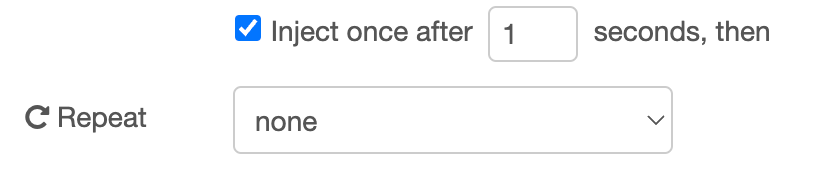
The inject nodes set msg.payload to boolean true or false (off = false.) The auto startup inject is configured to send true after 1 second. If you have issues with logging starting automatically on start up, this time should be increased so that the devices are ready within BlueOS to communicate.
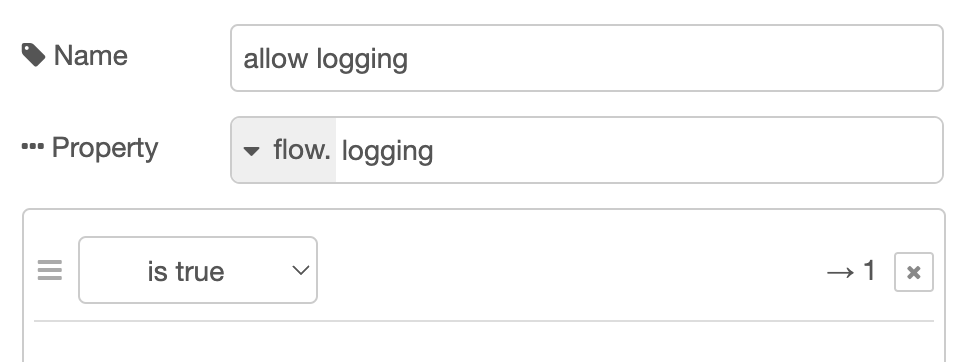
The output of the CSV node thus only gets through the “allow logging” switch node if the flow.logging variable adjusted by the change node is true.
Sending Values to a Dashboard
The Node-RED Dashboard palette makes the creation of simple dashboards with graphs, gauges and buttons/switches incredibly easy! The same VE.Direct to JSON function output that routes to our logging nodes can also be directed to a graph or gauge.
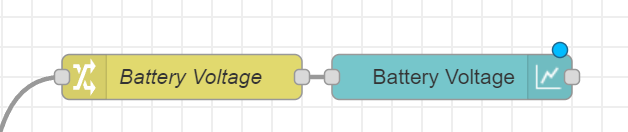
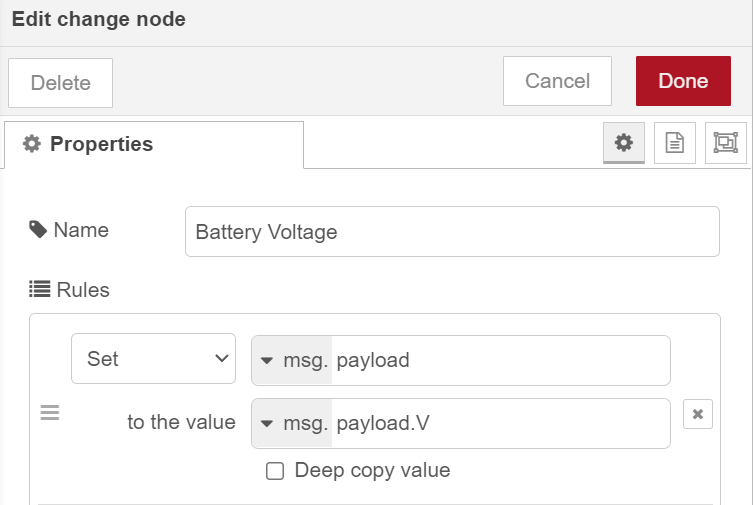
The Battery Voltage is extracted with a Change node that is configured to set the overall message payload to the Voltage value from the overall message.
A Chart node from the Dashboard set can then be connected and adjusted to your preferences.
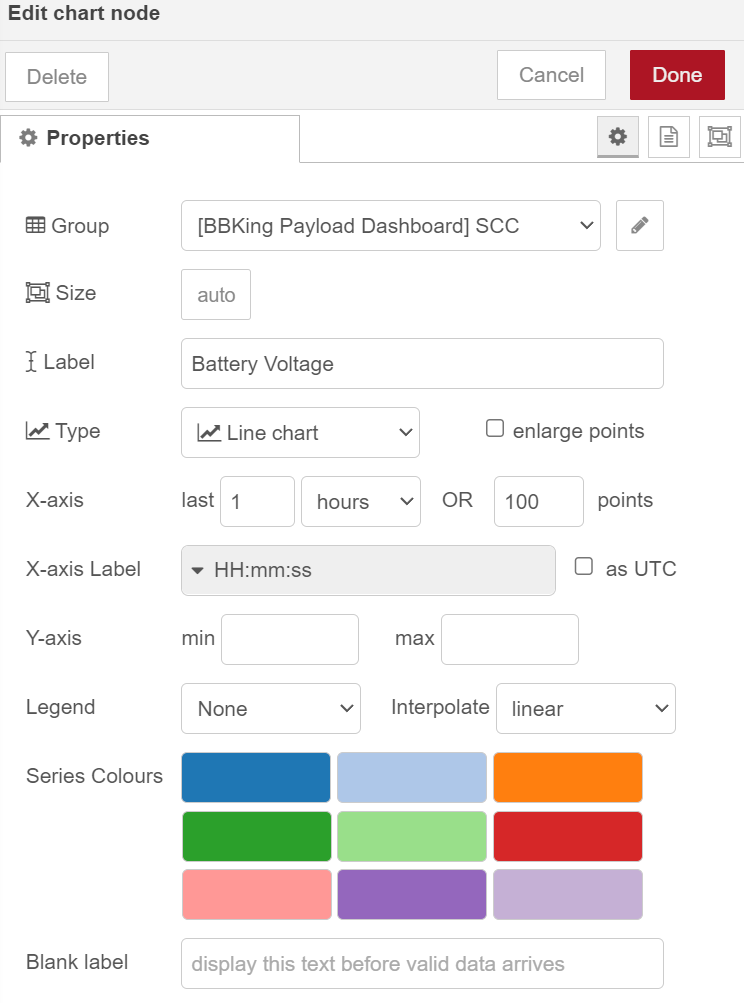
You can view the dashboard by selecting it from the menu in the upper right, and then clicking the arrow to open it in another tab. If you’re reaching BlueOS via ZeroTier, you can bookmark this link for easy access on connected devices in the future! If you’d like to combine multiple line graphs on a single chart, this is also possible.
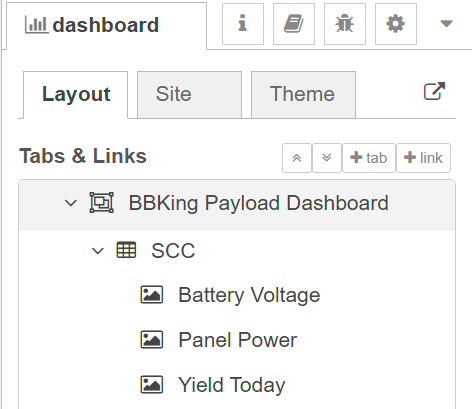
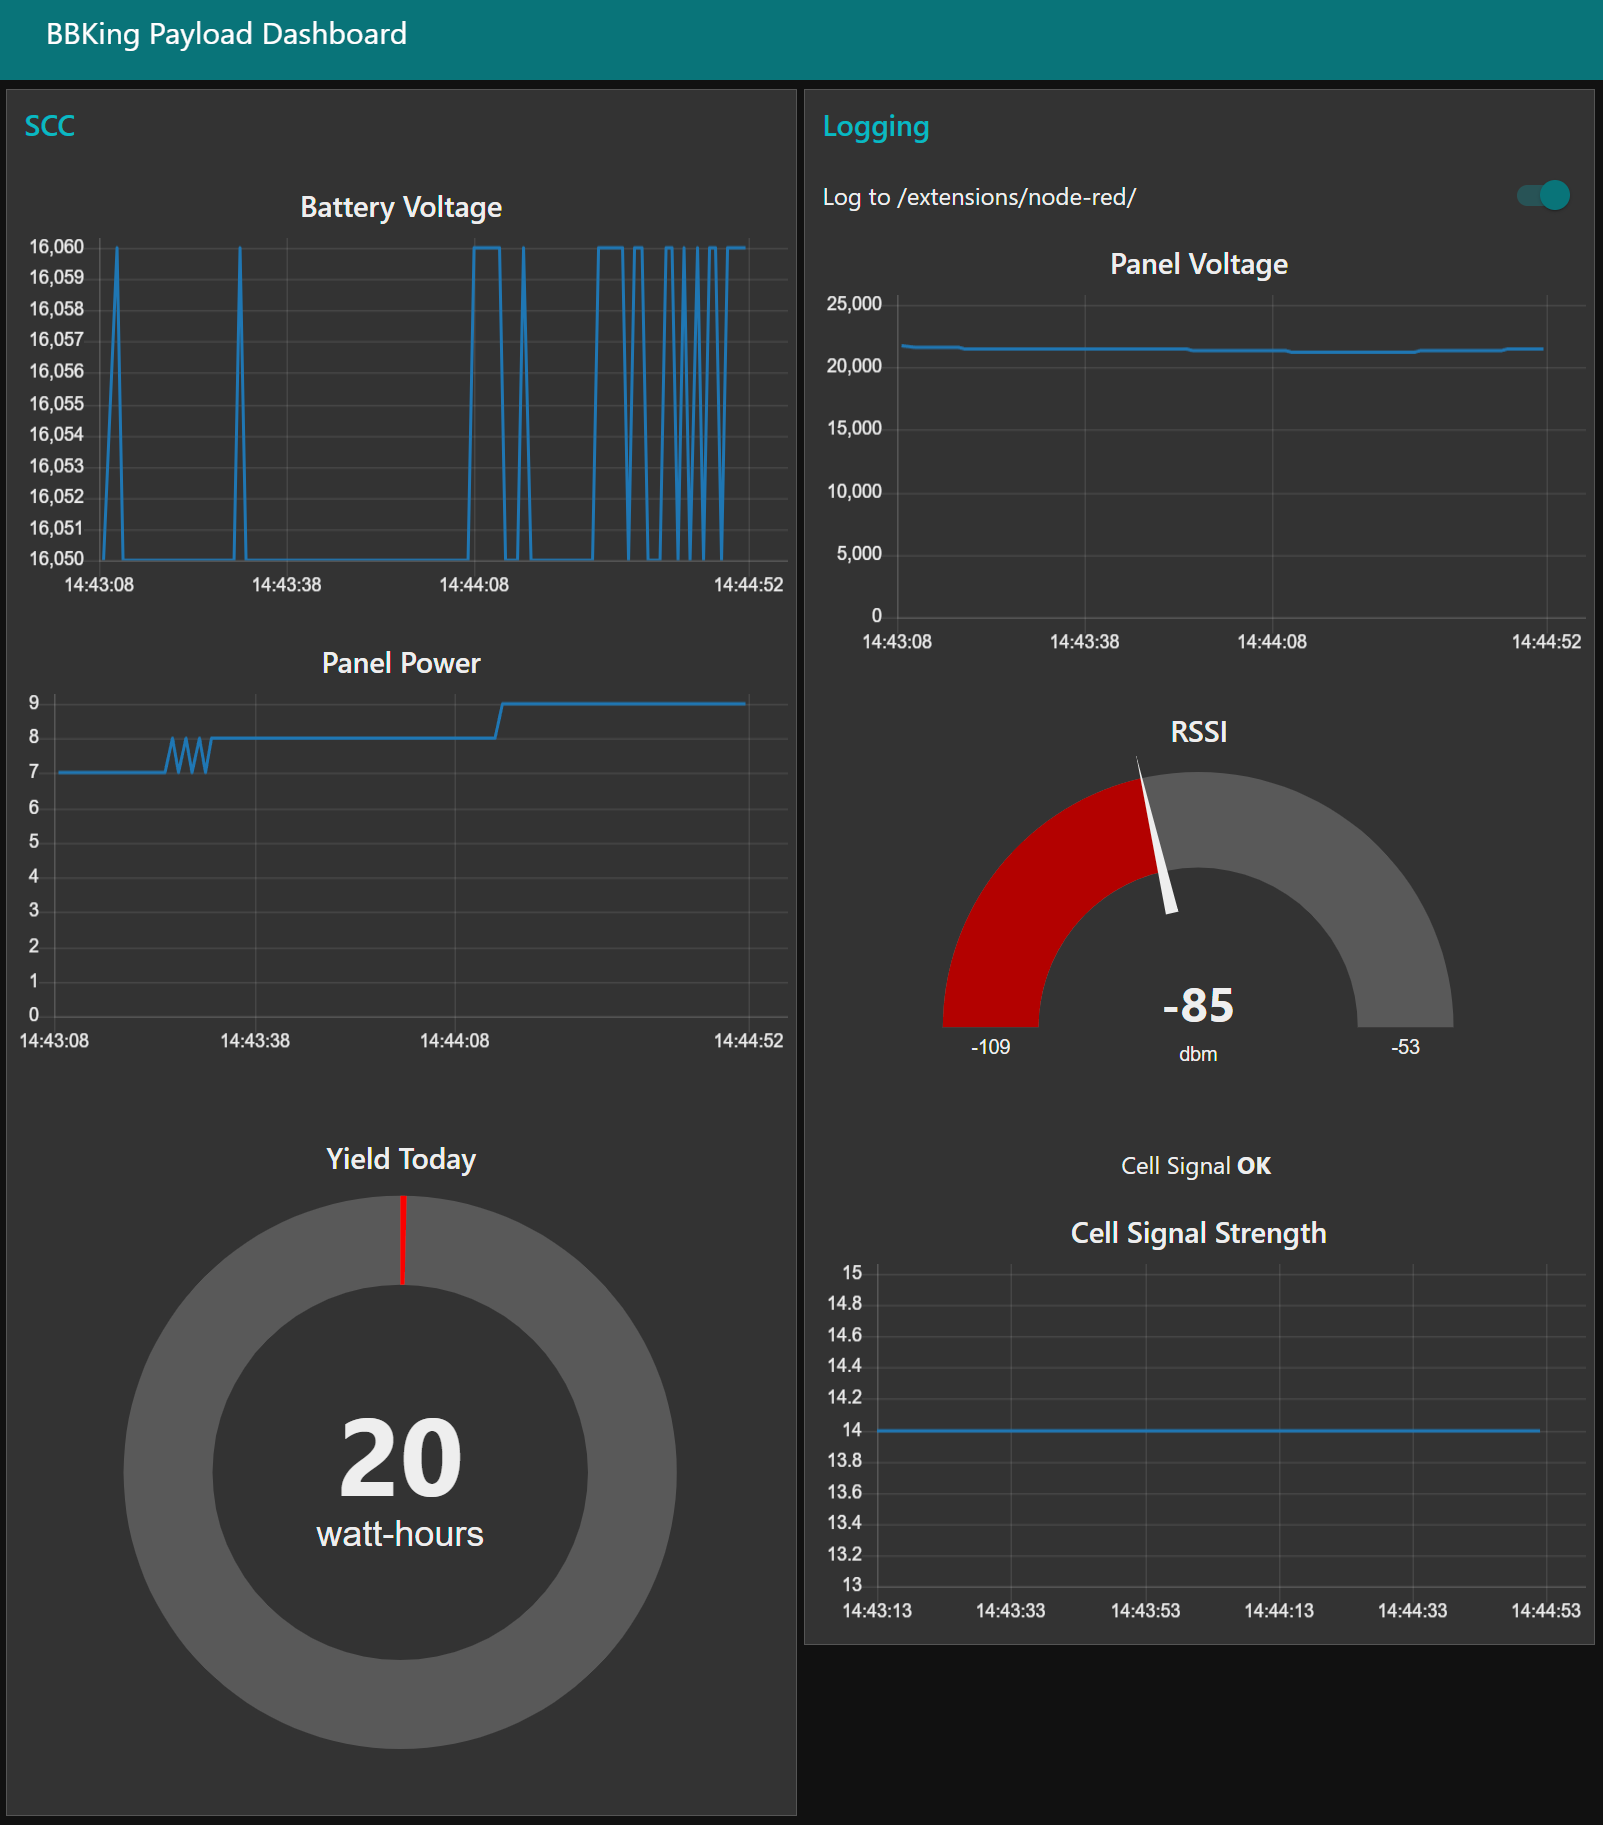
The complete dashboard from this guide is shown below – let’s move on to handling the USB cellular modem as a serial device, to have the necessary nodes to create the dashboard as shown!
Serial Device Setup: USB Cellular Modem
Hardware Setup
The USB cellular modem selected can present as multiple serial interfaces within the BlueOS linux environment. Two of these are in use to provide internet access to the system, however one is a serial port used for configuration of the hardware. This configuration interface is used to configure the APN for the modem, but it can also be used to poll the modem!
The same /dev/serial/by-id identification of the correct communications port must be accomplished to poll the USB Cell modem for data.
Call/Response
The Solar Charge Controller provided a serial data message at 1Hz automatically, but in the case of this cellular modem, a command must be sent in order to receive the desired signal strength information.
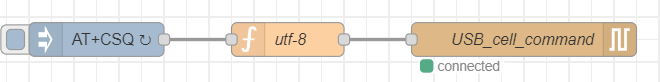
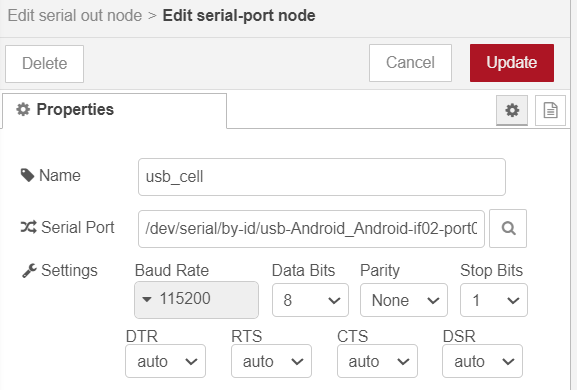
The AT+CSQ command is sent at 1Hz by an Inject node. This is converted to utf-8, and then routed to a Serial Out node that is configured to point to the correct serial device ID.
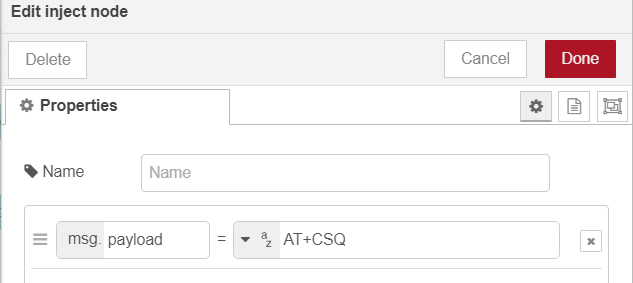
The frequency of the “call” can be adjusted in the inject block.
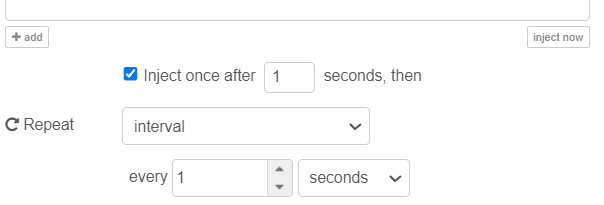
Converting the message to utf-8 before sending to serial port
Make sure to configure not only the correct Serial Port for your device, but the appropriate baud rate!
With our “call” outgoing at 1Hz, we can now read the response in a similar manner to the Solar Charge Controller. A Serial In node connects to the same serial port, and is routed to a function to process the received data.
That response given, the signal cell strength quality value, is converted to an RSSI and quality estimate based on available documentation. This function node uses a lookup table to map the received value to both RSSI and signal condition.
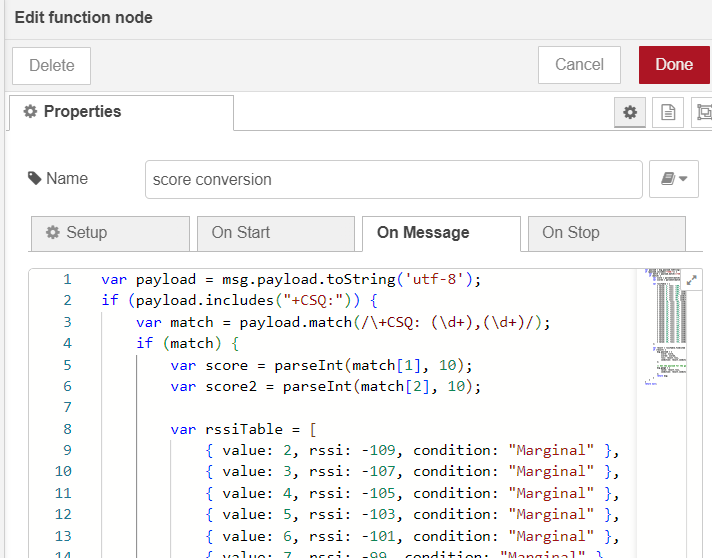
var payload = msg.payload.toString('utf-8');
if (payload.includes("+CSQ:")) {
    var match = payload.match(/\+CSQ: (\d+),(\d+)/);
    if (match) {
        var score = parseInt(match[1], 10);
        var score2 = parseInt(match[2], 10);


        var rssiTable = [
            { value: 2, rssi: -109, condition: "Marginal" },
            { value: 3, rssi: -107, condition: "Marginal" },
            { value: 4, rssi: -105, condition: "Marginal" },
            { value: 5, rssi: -103, condition: "Marginal" },
            { value: 6, rssi: -101, condition: "Marginal" },
            { value: 7, rssi: -99, condition: "Marginal" },
            { value: 8, rssi: -97, condition: "Marginal" },
            { value: 9, rssi: -95, condition: "Marginal" },
            { value: 10, rssi: -93, condition: "OK" },
            { value: 11, rssi: -91, condition: "OK" },
            { value: 12, rssi: -89, condition: "OK" },
            { value: 13, rssi: -87, condition: "OK" },
            { value: 14, rssi: -85, condition: "OK" },
            { value: 15, rssi: -83, condition: "Good" },
            { value: 16, rssi: -81, condition: "Good" },
            { value: 17, rssi: -79, condition: "Good" },
            { value: 18, rssi: -77, condition: "Good" },
            { value: 19, rssi: -75, condition: "Good" },
            { value: 20, rssi: -73, condition: "Excellent" },
            { value: 21, rssi: -71, condition: "Excellent" },
            { value: 22, rssi: -69, condition: "Excellent" },
            { value: 23, rssi: -67, condition: "Excellent" },
            { value: 24, rssi: -65, condition: "Excellent" },
            { value: 25, rssi: -63, condition: "Excellent" },
            { value: 26, rssi: -61, condition: "Excellent" },
            { value: 27, rssi: -59, condition: "Excellent" },
            { value: 28, rssi: -57, condition: "Excellent" },
            { value: 29, rssi: -55, condition: "Excellent" },
            { value: 30, rssi: -53, condition: "Excellent" }
        ];


        var result = rssiTable.find(item => item.value === score);
        if (result) {
            msg.payload = {
                score: score,
                score2: score2,
                rssi: result.rssi,
                condition: result.condition
            };


            // Set the payload for the gauge
            msg.gauge = {
                value: result.rssi,
                condition: result.condition
            };
            return msg;
        }
    }
}
return null;
As found in the overall Flow provided, the data can be logged with timestamp in the same manner, controlled by the same switch used to regulate the other logging nodes. A Gauge type display is used for the cell signal strength on the dashboard in the example flow as well.
Mavlink2Rest - Adding Data to the Overall Vehicle Log
Mavlink is a very lightweight messaging protocol for communicating between various devices, particularly the ArduSub and ArduRover autopilot processes. The Mavlink2Rest system makes the autopilot telemetry stream available for both input and output of messages, which if properly formatted get saved to the mission log. These ArduPilot .BIN logs are incredibly useful when analyzing a mission. They contain time-synced values for all sensors and other inputs and outputs of the autopilot system, and can easily be reviewed with this handy web tool. By sending data to the Mavlink2Rest interface as a NamedValue Float, it will automatically be logged to the .BIN file when the vehicle is armed (or always if the logging parameter is configured this way.) In the future, displaying these values in real time in the form of a widget in the Cockpit interface will be possible.
To send data to the Mavlink2Rest interface, we need to package it as an appropriately formatted HTTP request. This code in a function block takes the input message and packages it as a “named value float” labeled “Cell.” Note that only 10 characters are available to label this with the packet format, blank cells of this 10 should have “\u0000”.
var newmsg;
newmsg= {
  "header": {
    "system_id": 255,
    "component_id": 0,
    "sequence": 0
  },
  "message": {
    "type": "NAMED_VALUE_FLOAT",
    "time_boot_ms": 0,
    "value": msg.payload.rssi,
    "name": [
      "C",
      "e",
      "l",
      "l",
      "\u0000",
      "\u0000",
      "\u0000",
      "\u0000",
      "\u0000",
      "\u0000"
    ]
  }
};
return { payload: newmsg };
The output of this function node is routed to an HTTP request node, with the POST method and URL configured to http://blueos.local:6040/v1/mavlink.
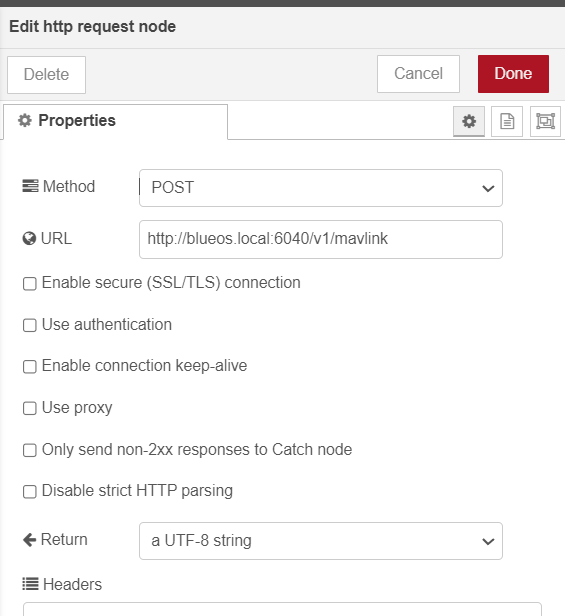
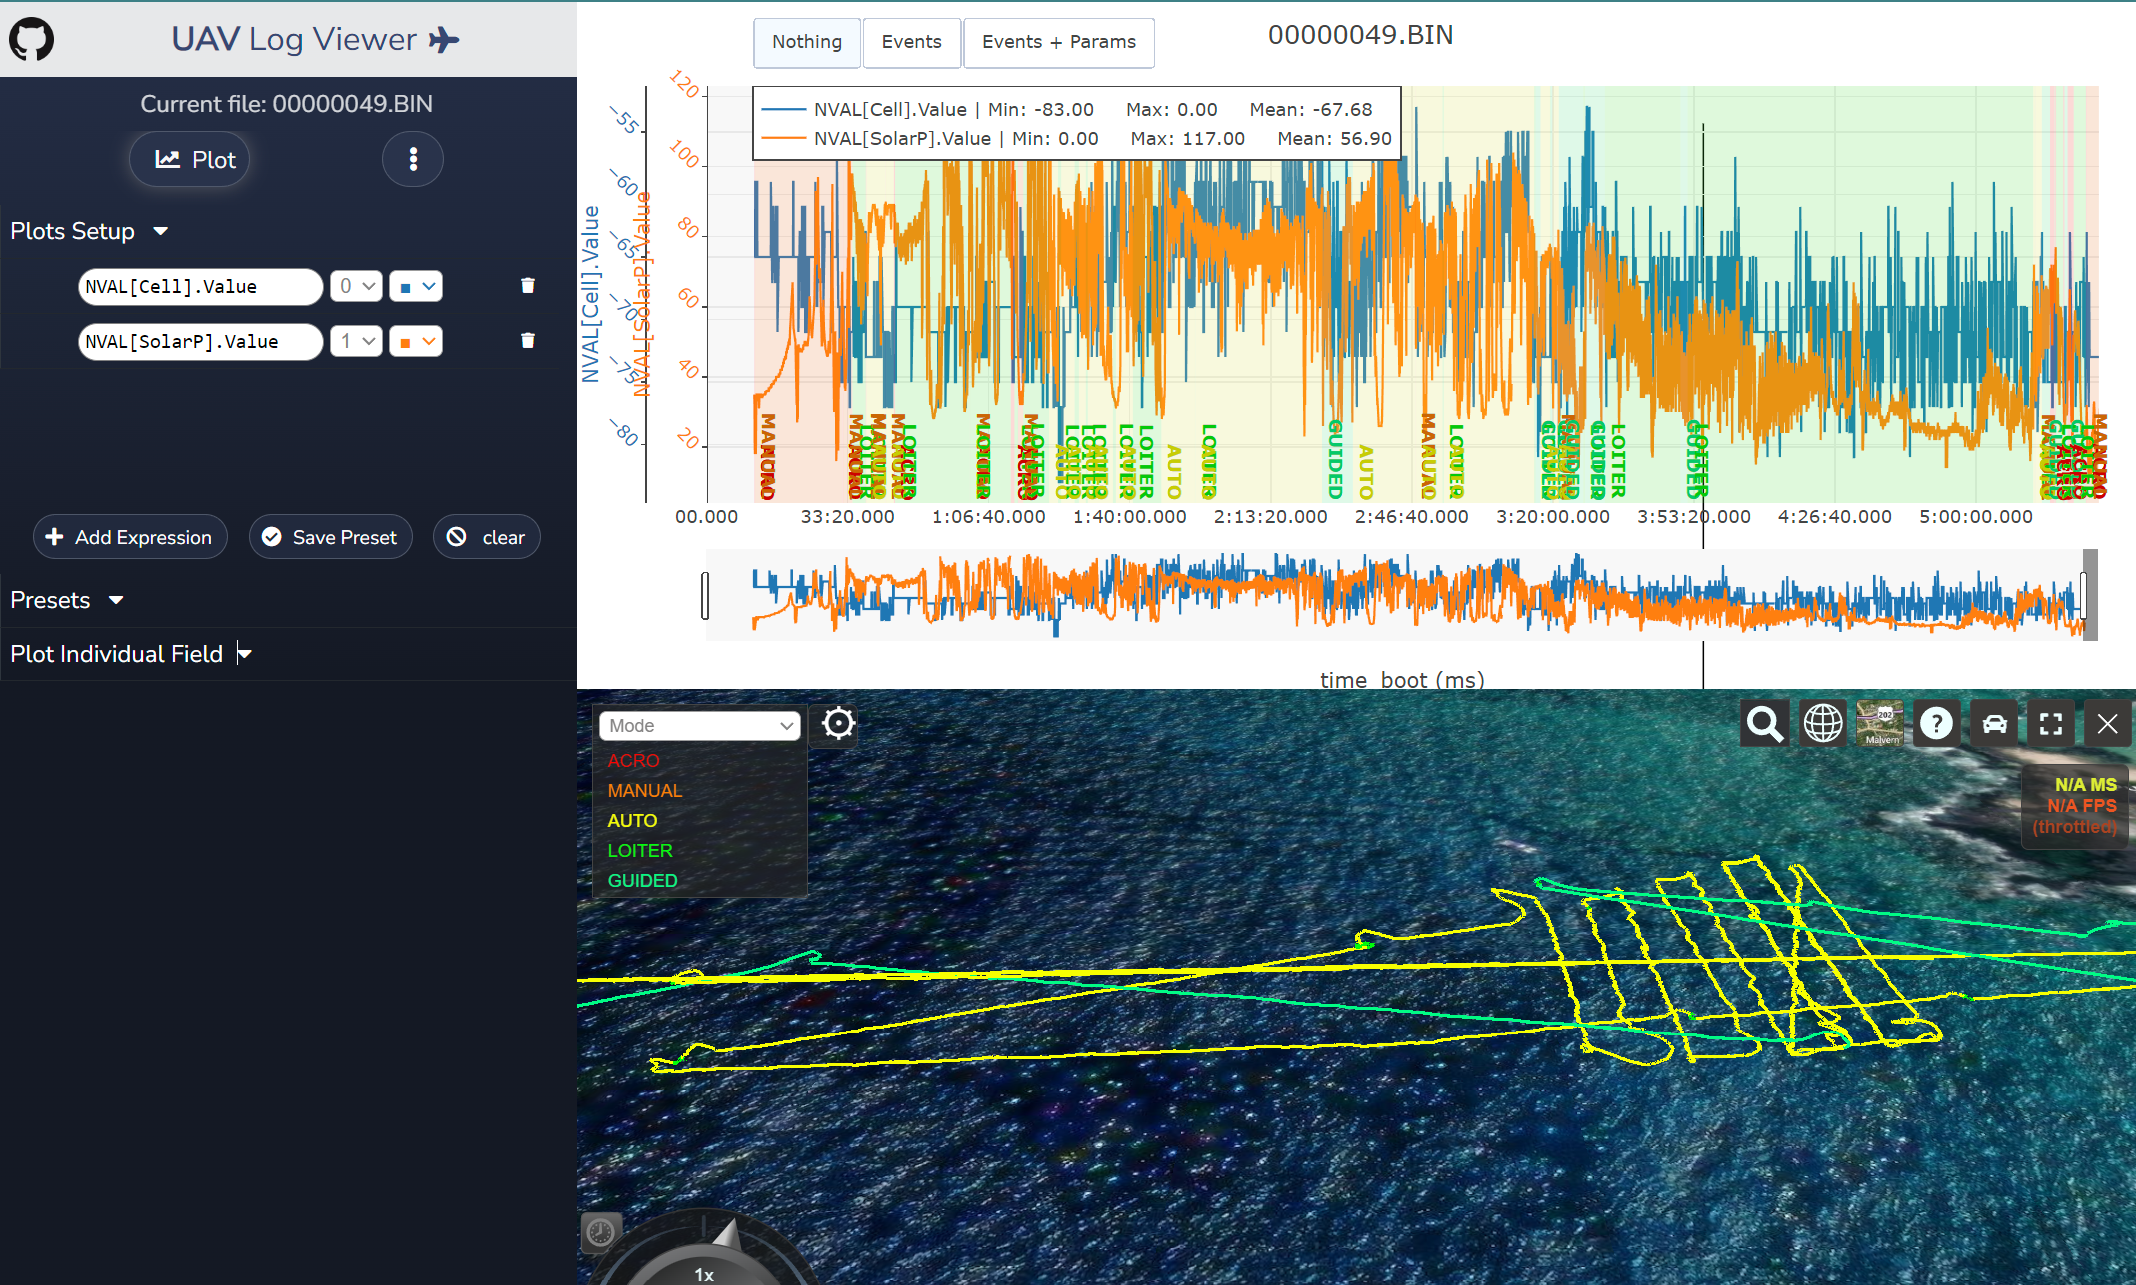
The overall example flow illustrates another Named Value float that is sent for Solar Power, with the same approach. Both of these are thus logged to the .BIN autopilot log, found in the Log Browser!
Getting Values into Cockpit
This may not be required in the future, but to forward your named value floats from Mavlink2Rest in a way that they can be displayed in Cockpit, a Lua script is used. This workaround using a Lua script that enables values to be displayed on the interface with a widget, with the telemetry also possible to overlay on recorded video via subtitles file.This script is copied to the ardupilot_logs/firmware/scripts directory, and the autopilot restarted. You’ll also need to be running a version of ArduSub after 4.5 (this is in Beta currently.) You can then use the “very generic indicator” mini widget in Cockpit, and search the name given for the Named Value Float to display the relevant values.
If you give this a try and have issues see the next section below!
Getting help
If you are working with Node-RED and BlueOS and find yourself spiraling in a whirlpool without making progress, follow up on this forum post that shared this guide with the community. Solving your troubles publicly helps everyone!
Authors

Tony White
Tony White earned his Mechanical Engineering degree from Georgia Tech in 2012 and began his career with large autonomous hydrographic survey vessels with C&C Technologies (Louisiana) and ASV Ltd. (England). He later moved to Los Angeles to join Ocean Lab, where he helped design and deploy a swarm of 50 marine surface drones—the “Data Diver”—his first major project using Blue Robotics components. After some aquaculture experience in Los Angeles, he went on to Forever Oceans in Hawaii (and Panama), where he developed innovative camera monitoring systems and resident BlueROV2 platforms for remote fish mortality extraction. Since 2023, Tony works in Blue Robotics’ Product Experience and R&D departments, where he assists customers with applications and tests both in-house and third-party products, the latter evaluated for potential resale on the Blue Robotics “Reef.”